SheetFlash Functions
Visualization / Format
Text Processing
Text Extraction
Table Manipulation
Join / Lookup
Date and Time
Sheet Processing
File Processing
Chart
Category: Visualization / Format Updated at: 2024-11-20
The Chart feature creates an Excel chart based on the selected cell range. This functionality invokes Excel’s standard charting feature, equivalent to selecting a range, navigating to the Insert tab, and choosing a chart type. You can choose from 52 chart types and specify a title to display on the chart.
See it in Action
Requirements
Data
Target Data
Data Range: Identify the cells range where you want to apply the function.
Chart Type: Select the one you want to delete.
Chart Title: Specify the title for the chart.
Result Destination
Specify the starting cell where the results will be placed.
Related Articles and Topics
Sheet Processing
November 29, 2024
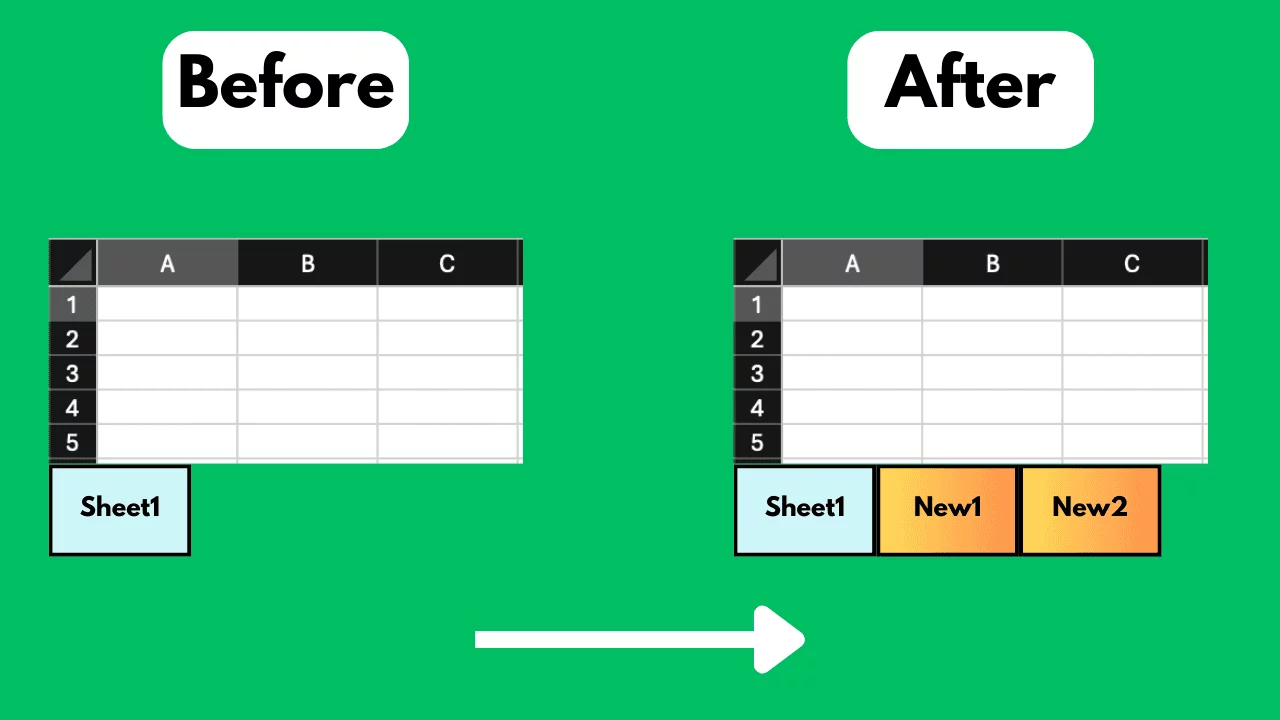
How to Add Excel Sheets in Bulk for Free?
Sheet Processing
November 28, 2024
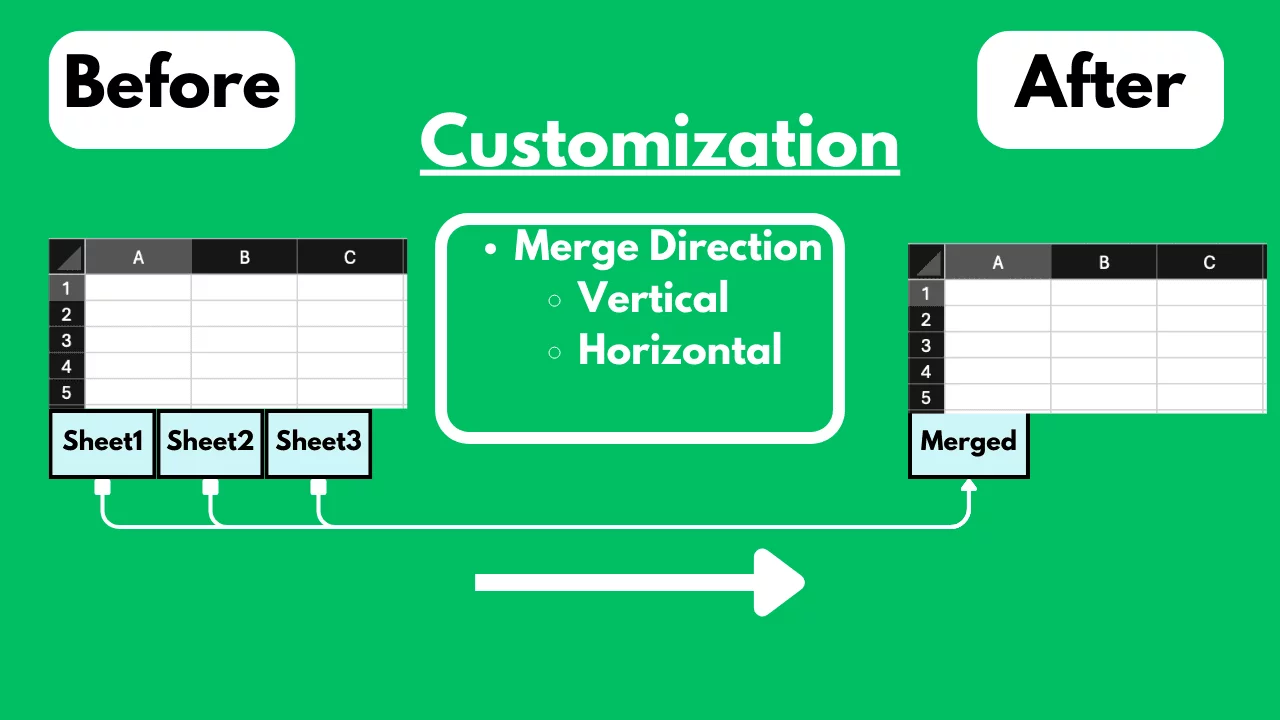
How to Merge Excel Sheets into One Sheet in Bulk for Free?
File Processing
November 27, 2024
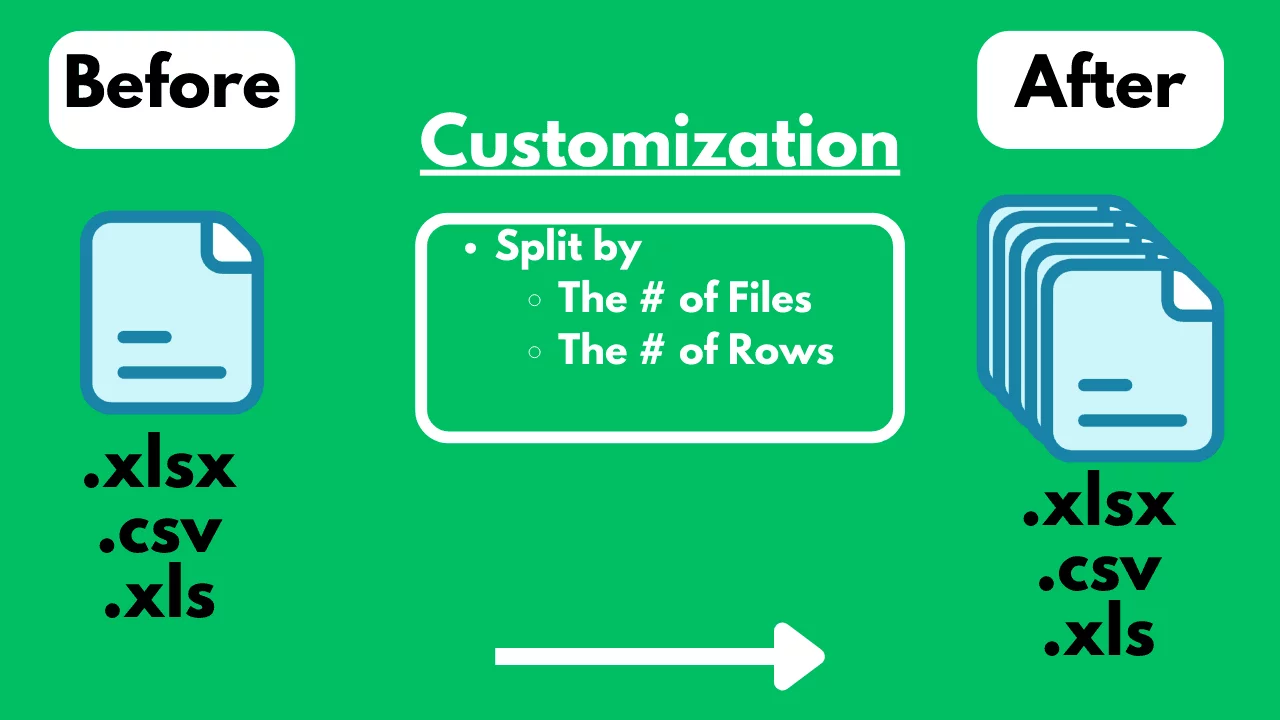
How to Split an Excel / CSV File into Multiple Files for Free?
File Processing
November 26, 2024
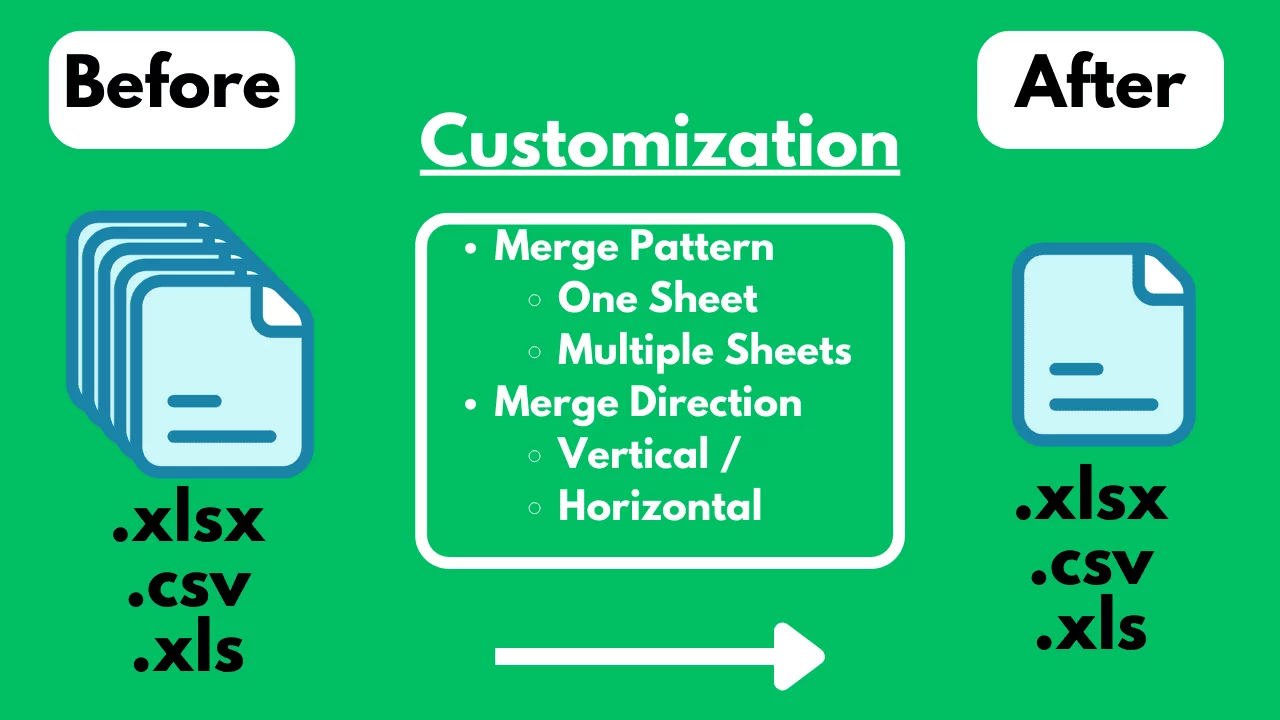
How to Merge Multiple Excel / CSV Files for Free?

SheetFlash Product
September 18, 2024
Is Excel Slow? Crashing? The Reasons Why and a Fast, Simple No-Code Solution | SheetFlash

SheetFlash Product
September 17, 2024
Accelerate DX with Excel Workflow Visualization and Automation | How to Achieve It with the No-Code Tool SheetFlash

SheetFlash Product
September 16, 2024
Master Excel Automation Without Coding: The Ease of Use of SheetFlash

SheetFlash Product
September 15, 2024
No VBA, No Python: Advanced Excel Data Transformation | SheetFlash

Table Manipulation
June 28, 2024
How to Expand Data in Excel in Bulk for Free?
Table Manipulation
June 25, 2024
How to FIlter Big Data in Excel in Bulk for Free?

Table Manipulation
June 25, 2024
How to Group Big Data in Excel in Bulk for Free?

Table Manipulation
June 25, 2024