

Yuto Saizen
Feb 3, 2025
Excel is a powerful tool that offers a myriad of features to create various types of charts, including hierarchical tree charts. This all-encompassing blog post will guide you through the most effective methods of creating these charts using Excel's tools, focusing on accessibility, functionality, and aesthetics. We'll also introduce SheetFlash, a dynamic tool for hierarchical chart creation, ensuring you create impressive visuals without needing additional research.
Introduction to Hierarchical Tree Charts
Before diving into the specifics of creating a tree chart, it's essential to understand what a hierarchical tree chart is. These charts are visual representations that depict relationships between different levels within an organization or system. Hierarchical tree charts are particularly useful in displaying the structure of an organization, showing the connection between departments and employees, or illustrating taxonomic trees in biological fields.
Tools for Creating Hierarchical Tree Charts
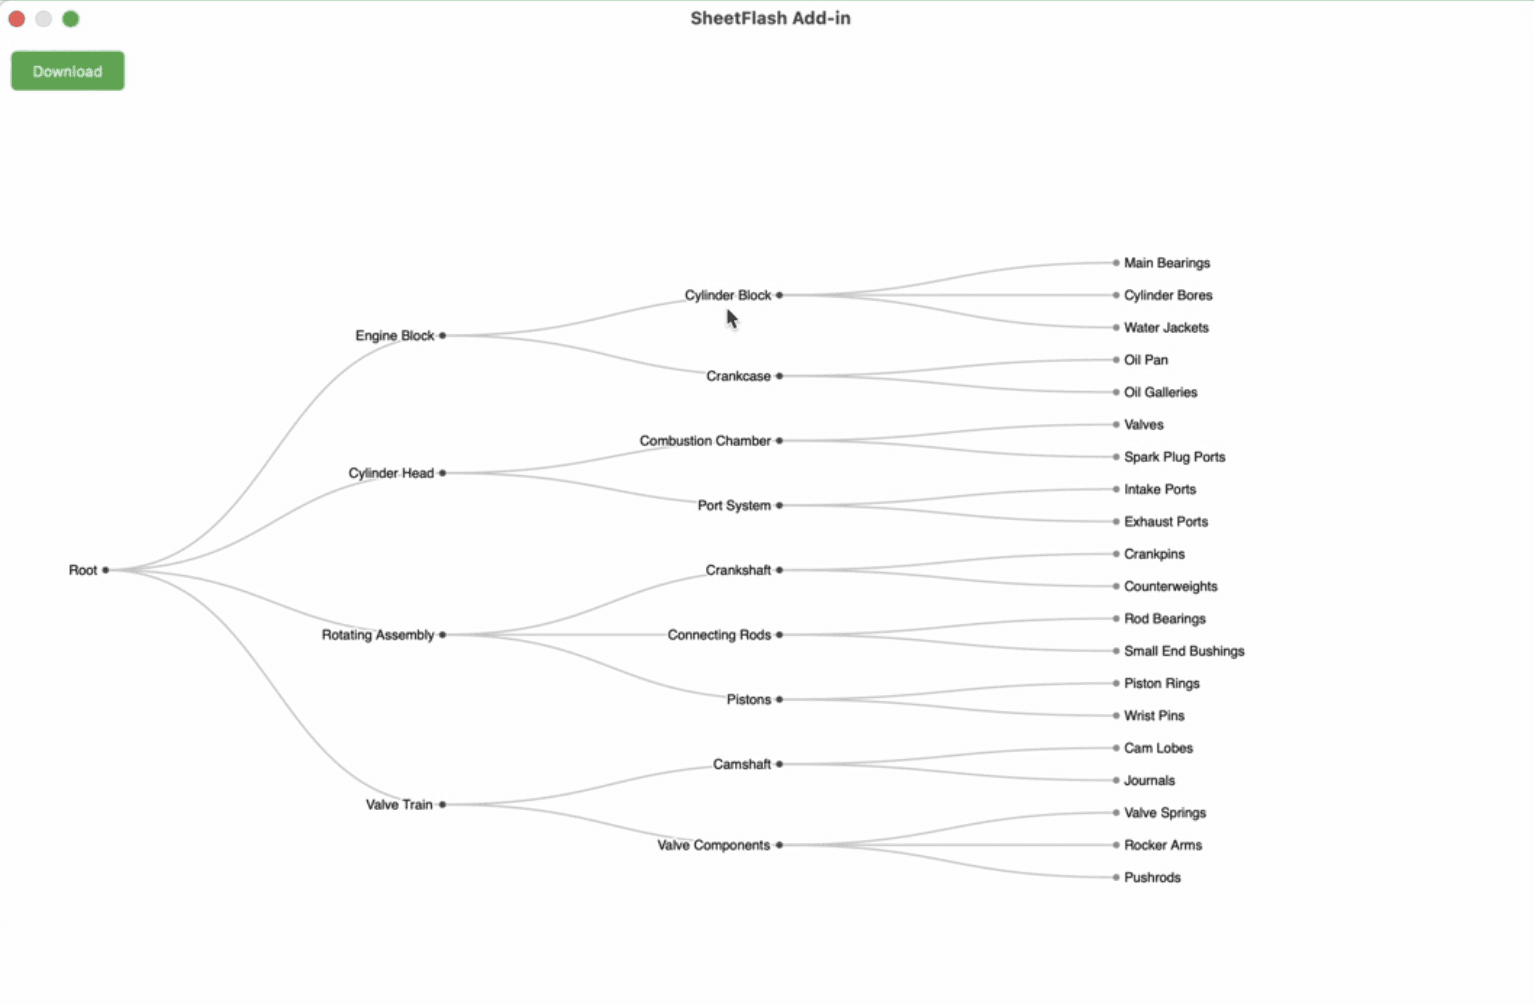
SheetFlash
SheetFlash offers an advanced solution for creating hierarchical tree charts, catering to both beginners and seasoned users.

Pros:
Charts are exceptionally beautiful and aesthetically pleasing.
Effortlessly create charts by importing Excel data directly, minimizing manual setup.
Offers dynamic chart features such as expanding and collapsing tree branches.
Supports transparent PNG downloads, enhancing compatibility with PowerPoint presentations.
Cons:
Limited customization for users wishing to design bespoke tree shapes.
SmartArt in Excel

Pros:
Built-in feature within Excel, making it easily accessible.
Offers various layouts and design templates for creating structured charts.
Enables simple customization of colors and styles.
Cons:
Limited dynamic features; not suitable for charts requiring real-time interactivity.
May not handle large-scale data visualizations well.
Summary
Creating beautiful hierarchical tree charts in Excel is feasible with built-in tools like SmartArt and additional resources such as SheetFlash and RawGraphs. While Excel provides excellent features for creating clear and professional charts, knowing when to leverage other tools like SheetFlash for dynamic and interactive elements can be beneficial, particularly for customization needs. With the guidance provided, you should have everything necessary to craft impressive tree charts that suit personal or professional needs.
In conclusion, understanding and using these methods optimally can elevate your data presentation, making it an insightful, visually attractive tool for analysis and communication. Whether you're in HR, research, or business, these strategies will ensure your hierarchical data is depicted with clarity and style.
New Articles

How to Use ChatGPT in Excel: The Ultimate Guide to AI-Powered Add-ins
Generative AI

Power Query 101: The Most Comprehensive & Easy-to-Understand Guide for Data Transformation in Excel and Power BI
Productivity Improvement Tools

Mastering Excel Table Joins Like SQL (Updated 2025)
Join / Lookup

Excel Online Macro Alternative Solution: No-Code Automation with SheetFlash (2025 Edition)
Automation

How to Use Power Automate for Excel: A Comprehensive Guide and Alternatives for 2025
Automation

Understanding RPA and IPA: Key Differences in Automation [2025]
Automation

Mastering Regex in Excel: The Ultimate 2025 Guide
Text Extraction

The Differences: SUM, SUMIF, SUMIFS, and SUMPRODUCT in Excel
Spreadsheet

Difference Between VLOOKUP, XLOOKUP, HLOOKUP, and LOOKUP in Excel
Join / Lookup

How to Create Bar Chart Race in Excel for free? (2025)
Data Visualization
Related Articles and Topics
How to Create Beautiful Hierarchical Tree Charts in Excel (2025)
Data Visualization
How to Create Bar Chart Race in Excel for free? (2025)
Data Visualization