Table of Contents
Why Data Scientists Still Use Excel in 2025?


Data science is often associated with cutting-edge tools like Python, R, and SQL, but there's another tool that continues to hold significant relevance: Microsoft Excel. Despite the rise of specialized data science platforms, a surprising number of data scientists still rely on Excel for various tasks. This blog post delves into the reasons why Excel remains a valuable tool in the data science toolkit, highlighting its capabilities, limitations, and how it can complement more advanced technologies.
Understanding Excel's Role in Data Science
Overview of Excel
Microsoft Excel is a spreadsheet program that provides functionalities for organizing, analyzing, and visualizing data. Initially released in 1985, its easy-to-use interface and versatile features have helped it remain a staple in many industries. Excel offers tools like pivot tables, VLOOKUP, and more recently, Power Pivot and Power Query, allowing users to handle more complex data tasks than ever before. Excel is the most handy tool for data display and editing, regardless of whether you can write programs or not.
Why Data Scientists Use Excel
Familiarity and Ubiquity:
Suited for: Professionals across various industries, including finance, marketing, and operations, where quick data analysis without needing extensive coding knowledge is paramount.
Not suited for: Tasks involving big datasets or needing advanced statistical analysis.
Ease of Use:
Excel is user-friendly and doesn't require extensive programming knowledge, making it accessible for quick, exploratory data analysis.
Interactive features like pivot tables allow for rapid data slicing and dicing with minimal effort.
It is ideal if everything can be completed in Excel without using any programming.
Quick Data Validation:
Excel is often used for validating data quickly before employing more robust data science tools. It serves as a first check for data quality and consistency.
Platform for Collaboration:
Excel files are easy to share and are often used as a common platform for department-level cooperation.
It is particularly useful in organizations where non-technical staff need to access and interpret data.
Visualization:
While not as powerful as specialized tools like Tableau, Excel provides sufficient basic visualization capabilities for simple charts and graphs.
Excel's Advanced Features
Power Tools Integration
Excel has evolved to include powerful features that enhance its capabilities:
Power Pivot: Provides in-memory data modeling, allowing users to work with large datasets beyond Excel's traditional row limits.
Power Query: Offers powerful data extraction, transformation, and loading (ETL) capabilities.
DAX (Data Analysis Expressions): A formula language designed for data analysis, enhancing computational power.
Overcoming Excel's Limitations
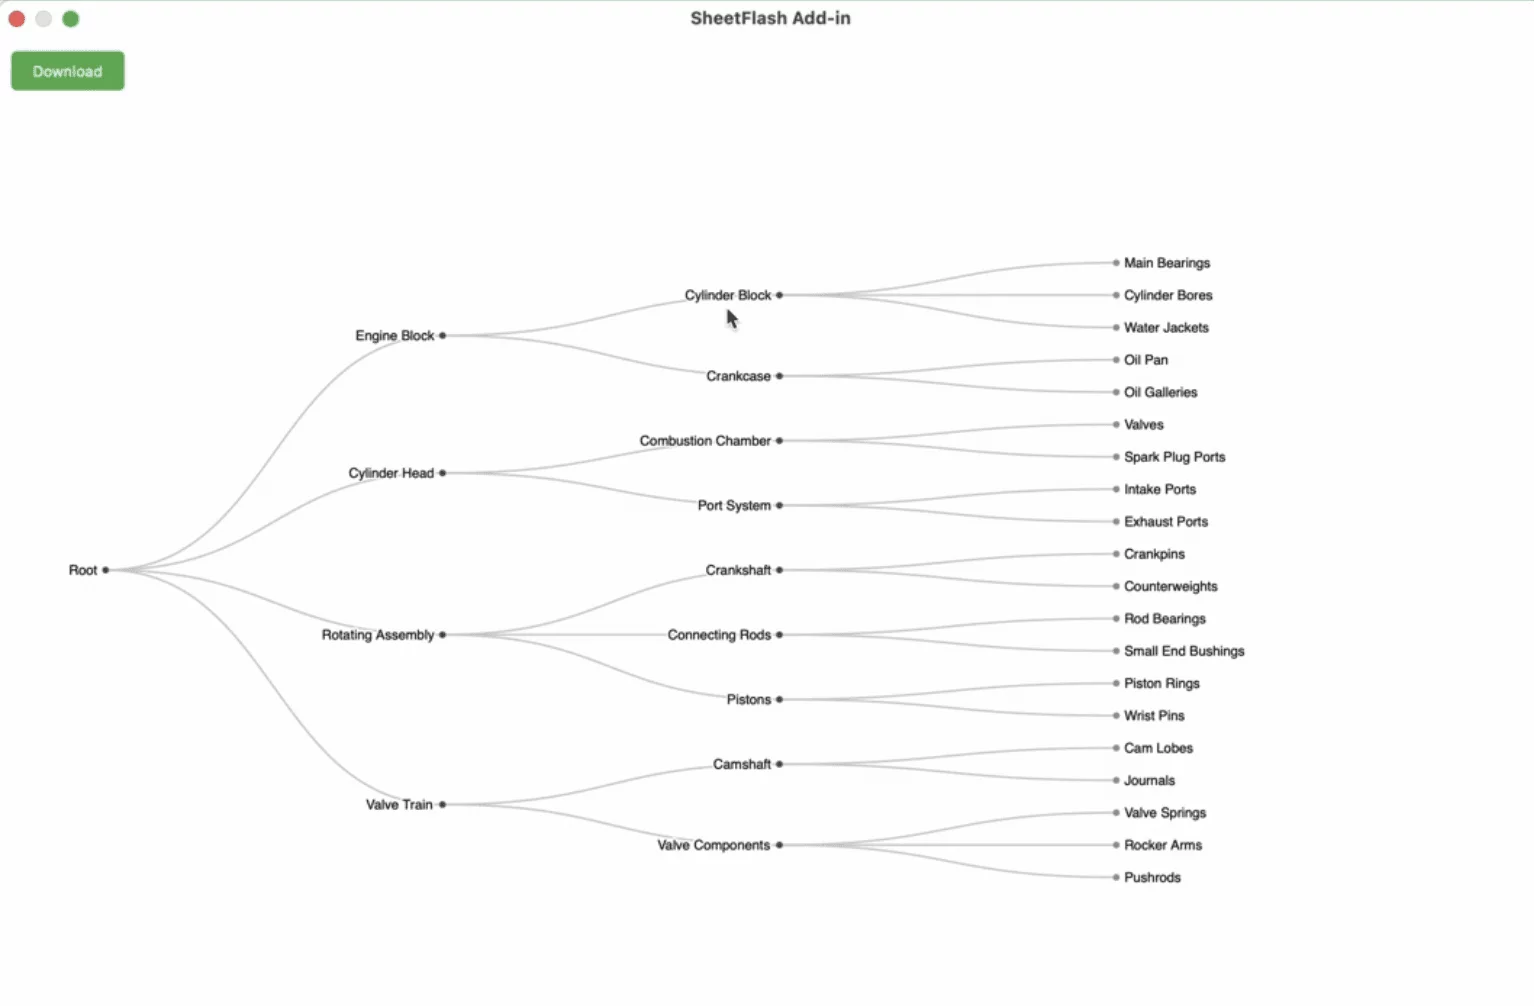
One of the advantages of using programming languages like Python is reproducibility. Conversely, this is a limitation of Excel. So, how can we overcome Excel's limitations and complete everything within Excel? The solution is SheetFlash. The SheetFlash Excel add-in enables ETL functions, which were previously only possible with Python or SQL, to be used within Excel with no code. This allows for faster data transformation tasks in Excel without needing to write any programs. Like Jupyter Notebooks in Python, all actions can be recorded and saved in SheetFlash, ensuring reproducibility.
Use Case: Financial Data Modeling
In finance, Excel is often used for creating detailed financial models. A typical scenario involves importing large financial datasets via Power Query, performing complex time-series analysis using DAX formulas in Power Pivot, and visualizing cash flow forecasts through charts and pivot tables—all within the Excel environment.
Comparative Analysis: Excel vs. Advanced Data Tools
Excel's simplicity is both its strength and limitation. Here's how it compares to more advanced tools:
Python:
Suited for: More advanced tasks, including machine learning, statistical analyses, and handling large datasets due to extensive library support.
Not suited for: Situations where end-users need to interact with data without programming skills.
Supplementary Role: Python's Pandas library can complement Excel by handling data processing, which is later exported back to Excel for visualization.
R:
Suited for: Statistical computations and detailed data analysis with packages that extend functionality.
Not suited for: Quick data manipulation tasks that benefit from a graphical interface.
Complementary Approach: R might be used for heavy statistical modeling, with results exported to Excel for presentation purposes.
Use Cases and Real-World Applications
Scenario: Business Reporting and Data Validation
Excel remains a favorite for business reporting due to its ability to quickly generate pivot tables and graphs from CSV datasets. For instance, a company may use a mix of SQL to query a database quickly, Python to process large sets of data, and then Excel for creating shareable reports that decision-makers can understand effortlessly.
Data and Statistics
According to a report by Market Research Future (2023), the global market for business intelligence tools is expected to grow by 11.1% from 2023 to 2030, with Excel occupying a significant role due to its historic and widespread use in the business sector.
Summary
The continued prevalence of Excel within the sphere of data science can largely be attributed to its enduring adaptability and the ongoing demand for intuitive data manipulation tools. While new-age tools like Python and R are ascendant in cutting-edge applications, Excel’s sheer ubiquity in business settings and its evolving capabilities ensure its relevance as a beneficial tool in a data scientist's repertoire.
In conclusion, while Excel may not be the preferred tool for every data science task, it remains an indispensable part of the toolkit for many. Its ease of use, convenience for quick data checks, and ability to present data in a digestible format ensure that it continues to be widely used in many sectors. For data scientists, Excel complements more advanced tools, offering an accessible and powerful means of engaging with data. By leveraging both traditional and modern data science tools, professionals can choose the right tool for the right task—ensuring efficiency and accuracy in data processing and analysis.


